 login
loginUN says 2013's extreme weather is due to warming earth (Page 3)
-
 No new posts


| Moderators: k9car363, alicefoeller | Reply |
|
 2014-03-28 3:47 PM in reply to: drewb8 2014-03-28 3:47 PM in reply to: drewb8 |

Pro  9391 9391     Omaha, NE Omaha, NE |  Subject: RE: UN says 2013's extreme weather is due to warming earth Subject: RE: UN says 2013's extreme weather is due to warming earthOriginally posted by drewb8 Originally posted by switch Not to mention the increased deaths from heatwaves are expected rise about 3.5x faster than the decrease in deaths from cold snaps. The increased crop production predictions are questionable too. They claim that warming in Canada and Siberia will make up for the loss of farmland in southern regions such as the US, but somehow they forget to mention that the soils up there are terrible for farming - mostly rocks, peats and moss. There's also less sunlight as you move north, that's the major factor limiting production, so even if you somehow fix the soil and don't get screwed by changes in precip (it's expected to become less frequent but more intense which isn't what farmers like), production is still going to be limited. Overall, I've seen absolutely NO evidence that the good outweighs the bad, and like you, the poor of the world are going to get especially screwed over.[Tol told Reuters the report plays down the possible economic benefits of low levels of warming, such as fewer deaths among the elderly in warmer winters and increased crop production in some regions. This statement is pretty telling. Elderly in what parts of the world? Crop production in what parts of the world? Certainly his statement isn't talking about the elderly and crop growing regions in Africa, India, and large sections of China, and mostly in extreme poverty. The reason most of his scientific peers don't want to talk about the "positives" is that it pretty much negates the value of people who are already struggling and have a history of being screwed by white, ethnocentric, capitalist interests. Tony, most of the reports I have seen show catastophic and irreversible damage with anything more than two degrees celsius increase. Even in places like Iowa and Nebraska From what I can tell, past IPCC reports were pretty heavily criticized for actually downplaying the risks and representing too conservative of a view. The first AR5 report which came out last year was on the science and overall followed that trend. Because of the requirement to reach a consensus and the general conservativeness of scientists it tends to if anything understate the risks. The upcoming report is on the risks of climate change, so by it's nature is going to sound more 'alarmist'. For one thing, it's because there are a lot of really good reasons to be alarmed, and second, because when talking about risks, it's better to to include everything, even if it's unlikely, rather than to leave something out that you later realize you should have considered. It's the same thing when you're doing any kind of risk planning, whether it's for a rescue operation or your companies' business environment next year. It seems like this guy's upset because in a report that's supposed to focus on risks, they're focusing too much on risks... Which studies are you referring to? I saw one from Emory University that was basing their heat wave deaths in 2057 based on 3.2 to 11.52 degree's of increase by the end of the century. Studies using numbers like those are no different than alarmist propaganda. Most of the stuff I've been able to find based on real world data speak of a warmer climate and more CO2 in the atmosphere as being a good thing with longer life expectancy, fewer winter deaths, lower energy costs, better agricultural yields, and richer biodiversity. Here's a couple studies supporting the benefits: (Life, Death, and Climate) - Stanford Advocates of reducing greenhouse gases typically assert that a warmer climate would increase disease and deaths worldwide. But fortunately those zealots are wrong. In fact, a warmer world would be world with fewer fatalities. Cold, not heat, is the biggest killer as more and more researchers are finding. Impact of CO2 fertilization on maximum foliage cover across the globe's warm, arid environments (Press Release Summarizing Study)
|
| 2014-03-28 5:14 PM in reply to: tuwood |
Pro 9391 Omaha, NE | Subject: RE: UN says 2013's extreme weather is due to warming earth Seems to be a lot in the news this week about AGW. Climate Forecast: Muting the Alarm So, according to the soon to be released AR5-WGII, if we have a 2.5 degree Celsius rise in temperature by the end of the Century (which is on the high side of the IPCC prediction) it will cost the world economy between .2 and 2 percent of it's GDP. Current global GDP grows about 3 percent per year, so it sounds like the devastating impact you guys are describing is not in agreement with the IPCC. |
| 2014-03-28 5:25 PM in reply to: tuwood |
Regular 5477 LHOTP | Subject: RE: UN says 2013's extreme weather is due to warming earth Originally posted by tuwood Seems to be a lot in the news this week about AGW. Climate Forecast: Muting the Alarm So, according to the soon to be released AR5-WGII, if we have a 2.5 degree Celsius rise in temperature by the end of the Century (which is on the high side of the IPCC prediction) it will cost the world economy between .2 and 2 percent of it's GDP. Current global GDP grows about 3 percent per year, so it sounds like the devastating impact you guys are describing is not in agreement with the IPCC. Tony, firstly, WSJ? It's the print version of Fox News when it comes to climate change. Secondly, the first paragraph smacks of the author's bias: The United Nations' Intergovernmental Panel on Climate Change will shortly publish the second part of its latest report, on the likely impact of climate change. Government representatives are meeting with scientists in Japan to sex up—sorry, rewrite—a summary of the scientists' accounts of storms, droughts and diseases to come. And this?
It's hard to feel like anything this article has to say is worth reading.
|

| 2014-03-28 5:37 PM in reply to: tuwood |
Master 4101 Denver | Subject: RE: UN says 2013's extreme weather is due to warming earth Originally posted by tuwood One thing is for sure an increase of 2 degrees Celsius would cause changes, but the interesting part is what evidence is out there to suggest that it's going to warm that much? Umm, your numbers? Even if you use the low end of your numbers we'll warm nearly that much. We've already warmed 0.8*C. If we warm 0.3*C every 30 years that's 0.9*C more this century and 1.7*C overall. As long as we track at the very low end.
You know it's cumulative thing, right? The warming this century will be on top of the warming we already have. We're already seeing pretty profound changes around the world at the 0.8*C warming we have now. For one thing, LBs 'shrooms are coming up later, which is baaad news. Even the low end, optimistic, denialist dream warming is 1.5*C by the end of the century which is almost double what we've seen so far. It might not be the 'worldwide devastation' the denialists like to alarm the denialists about the alarmists about but it's going to be some big changes.
We know that that avg global temp for the 20th century is about 57.2*F. And we know the range of the variability from that avg that we'd expect to see if there were no forcings adding energy to the climate. We don't expect the earth's temp to be exactly 57.2*F every year, we expect some years to be above that and some to be below that, and most of the time to fall within a certain range - this range around the mean is the natural variability. The increase from 1925-1944 (BTW - the change was only about 0.3* for this period) falls within this range of natural variability from the mean. We went from about 0.2*F below avg to about 0.1*F above avg. In contrast, the temp change we saw starting in the late 70's started at about the 20th century avg and has gone up to nearly 0.6*F above avg, which is outside the range of natural variability. In addition, if it were solely due to natural variability, we'd expect to see temps below avg as well as above, but that's not what we're seeing. We're seeing only deviations above avg, which lets us know that something else besides natural variability is driving the changes.
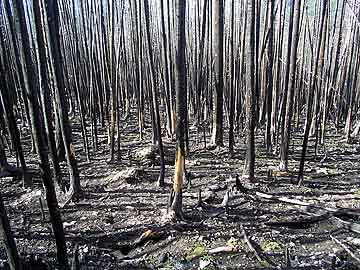
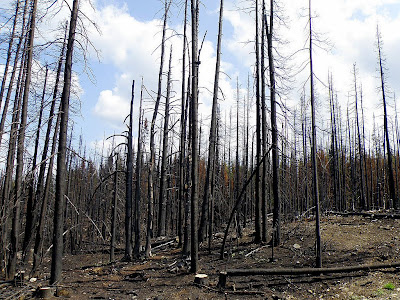
Here's two pictures of forest fires. One was caused by lighting and one was caused by humans. Which is which?
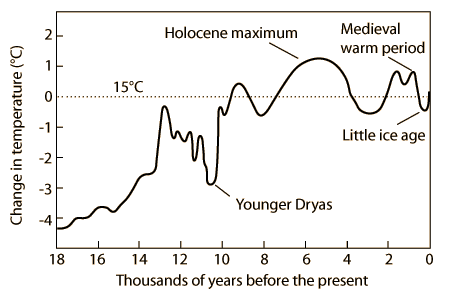
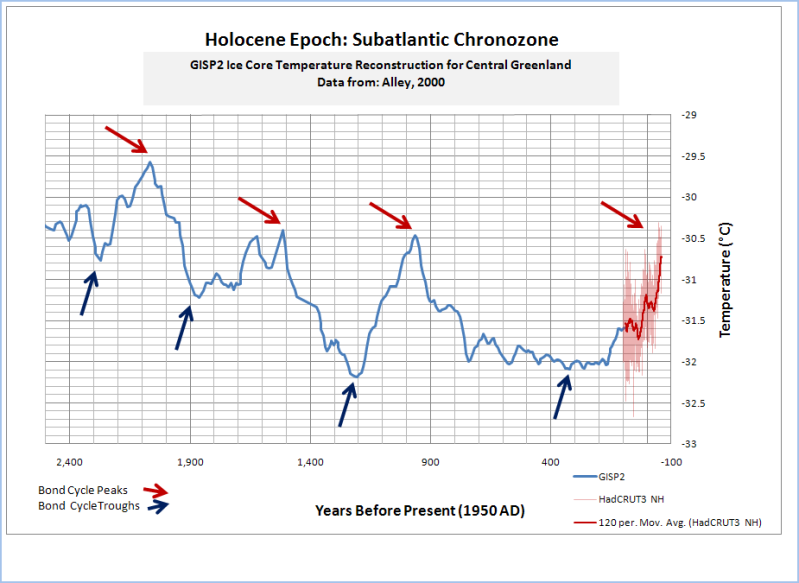
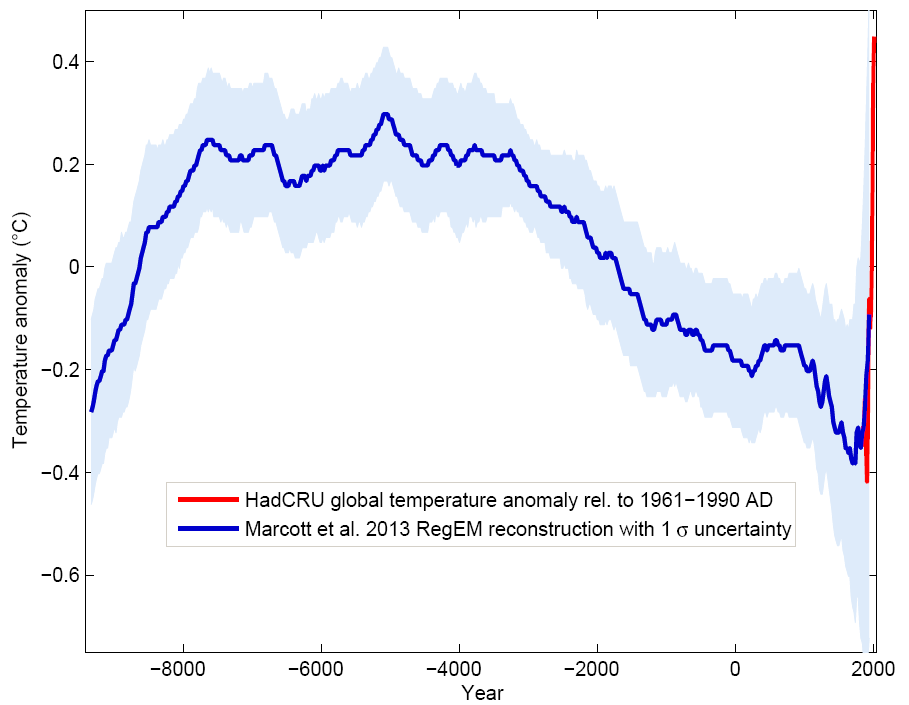
Maybe it would be a little more helpful to see the data actually plotted instead drawn by someone at their desk. Here's temperature for the last 11,000 years. It's a little outdated but'll have to do.
The IPCC and pretty much all legitimate climate scientists agree that there has been no increase in temperatures since the late 90's and that the predicted warming between 1998 to 2012 is much smaller than the trend from 1998 to 2012. That's based on factual data, so there's no arguing it. You should make a pie with all the cherries you picked here. 1st of all, no scientists don't agree there's been no increase in temps since 1998. In fact 13 of the 14 hottest years ever were in this century and 2001-2010 was the hottest decade on record. Why start at that particular year? Because 1998 just happened to be one of the hottest years on record.
If you start at any other year, surprise, surprise, you get an increasing trend. But wait, it turns out that even if you start at 1998 there's a positive trend, although yes, it's lower.
Scientists are still troubled by the pause and trying to explain it. The most prevalent theory is deep ocean heat absorption as a cause. Ocean heat content has increased since the 1990's. That's based on factual data, so there's no arguing it.
And when you combine the atmospheric temperatures (which have seen a decrease in the rate of warming) and the heat in the oceans it turns out that overall warming has actually sped up over the last 15 years, even though atmospheric warming has slowed down. The reason for the slowdown is still being researched, but like you mention, much of the extra heat is being stored in the oceans. Increased aerosols are thought to play a part as is natural variability - this period has seen more La Ninas than normal which are associated with a lower global temperature than normal (although the last 4 La Nina years had higher avg temps than any El Nino year before 1998). I like Dr. Lindzen from MIT's response: “Their excuse for the absence of warming over the past 17 years is that the heat is hiding in the deep ocean, however, this is simply an admission that the models fail to simulate the exchanges of heat between the surface layers and the deeper oceans.” “However, it is this heat transport that plays a major role in natural internal variability of climate, and the IPCC assertions that observed warming can be attributed to man depend crucially on their assertion that these models accurately simulate natural internal variability, thus, they now, somewhat obscurely, admit that their crucial assumption was totally unjustified.” By all accounts Lindzen is a pretty smart guy, so it can't be that he's ignorant of how climate models work. So he must know that yes actually, climate models do simulate the transfer of heat in the oceans. He must also know that climate models don't try to simulate natural internal variability such as ENSO because over the long run the positives and negatives from natural variability should cancel out and the purpose of models is to look for long term trends. He must also know that when you enter observed ENSO events into the climate models they do a really good job of simulating the so-called 'pause'. Although it does seem strange that for such a smart guy he's wrong so often. Here's a list of other positions he's had that he's been proven wrong on or no longer believes:
|


| 2014-03-28 5:52 PM in reply to: drewb8 |
Regular 5477 LHOTP | Subject: RE: UN says 2013's extreme weather is due to warming earth Can I buy you a beer or something? The burned forest pics, excellent. The "smoking doesn't cause lung cancer" final tip, chapeau. But this, this is priceless: "It might not be the 'worldwide devastation' the denialists like to alarm the denialists about the alarmists about but it's going to be some big changes." |
| 2014-03-28 6:05 PM in reply to: 0 |
Master 4101 Denver | Subject: RE: UN says 2013's extreme weather is due to warming earth Originally posted by tuwood "But fortunately those zealots are wrong" Wow, wonder how he got that through the peer-review process. Oh wait. The study I was referring to is hereWhich studies are you referring to? I saw one from Emory University that was basing their heat wave deaths in 2057 based on 3.2 to 11.52 degree's of increase by the end of the century. Studies using numbers like those are no different than alarmist propaganda.
Most of the stuff I've been able to find based on real world data speak of a warmer climate and more CO2 in the atmosphere as being a good thing with longer life expectancy, fewer winter deaths, lower energy costs, better agricultural yields, and richer biodiversity. Here's a couple studies supporting the benefits: (Life, Death, and Climate) - Stanford Advocates of reducing greenhouse gases typically assert that a warmer climate would increase disease and deaths worldwide. But fortunately those zealots are wrong. In fact, a warmer world would be world with fewer fatalities. Cold, not heat, is the biggest killer as more and more researchers are finding. Impact of CO2 fertilization on maximum foliage cover across the globe's warm, arid environments (Press Release Summarizing Study)
As for the CO2 fertilization. Ahhhh... Finally something I know something about! So, if you notice, that study was looking at the effects of arid ecosystems where the vegetation is already adapted to use water efficiently. This is important because one big effect of CO2 fertilization is an increase in water use efficiency by the plant. Because of this adaptation, the vegetation is already used to making do with little water and can focus on increasing production, ie greening up. Great if we want to switch our diet to cactus or woody shrubs. In CO2 enrichment experiments in other ecosystems such as forests and grassland though we don't see this long term effect. What we see is an initial spike in production as the plants use the elevated CO2 to grow more. But plants need other nutrients to grow besides CO2 and after a few years, they draw down nutrients in the soil such as nitrogen. Without these nutrients, the plants are unable to use the extra CO2, so their growth returns to the original level. We also see a downregulation of growth after a while. in plants that aren't adapted to arid conditions, it turns out they'd rather increase their growth a little and use less water than increase their growth a lot and use more water. There are also physiolgical constraints to plant growth. If you get temps that are too high for too long it'll just kill the plant and it doesn't matter how much CO2 it has available. Same goes for water. you can have all the CO2 you want, but if you don't have water, you aren't growing anything. Also, increased temps mean an increase in forest fires as we're seeing. which also has negative effects on timber production. Edited by drewb8 2014-03-28 6:08 PM |
| 2014-03-28 6:10 PM in reply to: switch |
Master 4101 Denver | Subject: RE: UN says 2013's extreme weather is due to warming earth |
| 2014-03-28 7:15 PM in reply to: switch |
Pro 9391 Omaha, NE | Subject: RE: UN says 2013's extreme weather is due to warming earth Originally posted by switch Originally posted by tuwood Seems to be a lot in the news this week about AGW. Climate Forecast: Muting the Alarm So, according to the soon to be released AR5-WGII, if we have a 2.5 degree Celsius rise in temperature by the end of the Century (which is on the high side of the IPCC prediction) it will cost the world economy between .2 and 2 percent of it's GDP. Current global GDP grows about 3 percent per year, so it sounds like the devastating impact you guys are describing is not in agreement with the IPCC. Tony, firstly, WSJ? It's the print version of Fox News when it comes to climate change. Secondly, the first paragraph smacks of the author's bias: The United Nations' Intergovernmental Panel on Climate Change will shortly publish the second part of its latest report, on the likely impact of climate change. Government representatives are meeting with scientists in Japan to sex up—sorry, rewrite—a summary of the scientists' accounts of storms, droughts and diseases to come. And this?
It's hard to feel like anything this article has to say is worth reading.
OK, after bashing Fox News and the WSJ what is factually incorrect about the articles representation of the IPCC's AR5-WGII? Obviously the guy has a slant, but don't we all. |
| 2014-03-28 10:02 PM in reply to: 0 |
Pro 15655 | Subject: RE: UN says 2013's extreme weather is due to warming earth Originally posted by switch Originally posted by Left Brain The convention in this country is to use "normal" to refer to averages in weather.Originally posted by switch Originally posted by Left Brain Darn those graphs, stats, and scientists--my memories and perceptions are infallible! Originally posted by switch Originally posted by Left Brain Well, I know it would have to be cold enough for hell to freeze over for you to concede a point 100's of people around that lake used to have ice boats too.....now nobody does. It used to be normal to skae near them and watch them race.....that hasn't happened in decades. It was "normal" back then. Same as mushrooms......my log shows first finds the last 10 years all before 3/15. Not normal, but no graph needed, or science. I wonder how people hundreds of years ago got by.....you know, before all the smart people came along. LOL  Yeah, this year was below normal. So were many of those winters in the 60s and 70s you remember. That's the funny thing about graphs and stats......and scientists too for that matter. I like your graph......it's a good illustration of the fact that not a single year on that graph is "normal".....there is only above and below "normal". You're right, I won't concede that if it NEVER happens it's "normal". Gotta head to a track meet.....happy sciencing. LOL I enjoyed a normal winter this year, it was good to see some of the old haunts back to normal. To establish below normal, we need to establish normal. That's what the graph does, and this winter is below normal and those winters you remember from the 60s and 70s were below normal. Absolutely not true. The graphs establish average, not normal. You want me to believe that average is normal, when I know that normal ALWAYS occurs either above or below average, it has to. In fact, in the case of temperature it's perfectly normal to be above or below avg. It is, in fact, normal to be way below or above average, your graph proves it. When I say that your mushrooms will pop somewhere very near the end of April, and you agree, I say that because in a normal winter like we are having, that's when it will happen, by my experience. You can call it semantics, but it's really not. In nature, average or abnormal rarely occurs.......normal rules.
Normal- The long-term average value of a meteorological element for a certain area. For example, "temperatures are normal for this time of year" Usually averaged over 30 years. http://www.erh.noaa.gov/er/box/glossary.htm I agreed that morels will come up at the end of April in a "normal," aka average year. This is not one of those. Not where I live. Not where you live. No, grey morels will come up here in the first week of April, fully 3 weeks later than the last few years, and about the time we have been getting the last of the yellows lately. You will have greys the last week of April, and will still be getting Yellows the 2nd week of May, watch and see. Perfectly timely for a winter like we just had.....perfectly NORMAL for this winter, as in normal winters of past years. Normal is almost NEVER average......it just doesn't happen. Look at your graph for proof. As for as memories of normal vs. a graph average that you think is so much better......how do you figure I knew that this winter was perfectly normal compared to winters in the 60's and 70's? You think I saw it in a graph? LOL Hey......next year when it's 31 degrees for a week or so I'm going to try to convince people to skate on the lake I mentioned.......I'm going to tell them you said it'd be frozen just fine. Edited by Left Brain 2014-03-28 10:15 PM |

| 2014-03-29 7:19 AM in reply to: 0 |
Regular 5477 LHOTP | Subject: RE: UN says 2013's extreme weather is due to warming earth Originally posted by Left Brain Originally posted by switch Originally posted by Left Brain The convention in this country is to use "normal" to refer to averages in weather.Originally posted by switch Originally posted by Left Brain Darn those graphs, stats, and scientists--my memories and perceptions are infallible! Originally posted by switch Originally posted by Left Brain Well, I know it would have to be cold enough for hell to freeze over for you to concede a point :)100's of people around that lake used to have ice boats too.....now nobody does. It used to be normal to skae near them and watch them race.....that hasn't happened in decades. It was "normal" back then. Same as mushrooms......my log shows first finds the last 10 years all before 3/15. Not normal, but no graph needed, or science. I wonder how people hundreds of years ago got by.....you know, before all the smart people came along. LOL Yeah, this year was below normal. So were many of those winters in the 60s and 70s you remember. That's the funny thing about graphs and stats......and scientists too for that matter. I like your graph......it's a good illustration of the fact that not a single year on that graph is "normal".....there is only above and below "normal". You're right, I won't concede that if it NEVER happens it's "normal". Gotta head to a track meet.....happy sciencing. LOL I enjoyed a normal winter this year, it was good to see some of the old haunts back to normal. To establish below normal, we need to establish normal. That's what the graph does, and this winter is below normal and those winters you remember from the 60s and 70s were below normal. Absolutely not true. The graphs establish average, not normal. You want me to believe that average is normal, when I know that normal ALWAYS occurs either above or below average, it has to. In fact, in the case of temperature it's perfectly normal to be above or below avg. It is, in fact, normal to be way below or above average, your graph proves it. When I say that your mushrooms will pop somewhere very near the end of April, and you agree, I say that because in a normal winter like we are having, that's when it will happen, by my experience. You can call it semantics, but it's really not. In nature, average or abnormal rarely occurs.......normal rules.
Normal- The long-term average value of a meteorological element for a certain area. For example, "temperatures are normal for this time of year" Usually averaged over 30 years. http://www.erh.noaa.gov/er/box/glossary.htm I agreed that morels will come up at the end of April in a "normal," aka average year. This is not one of those. Not where I live. Not where you live. No, grey morels will come up here in the first week of April, fully 3 weeks later than the last few years, and about the time we have been getting the last of the yellows lately. You will have greys the last week of April, and will still be getting Yellows the 2nd week of May, watch and see. Perfectly timely for a winter like we just had.....perfectly NORMAL for this winter, as in normal winters of past years. Normal is almost NEVER average......it just doesn't happen. Look at your graph for proof. As for as memories of normal vs. a graph average that you think is so much better......how do you figure I knew that this winter was perfectly normal compared to winters in the 60's and 70's? You think I saw it in a graph? LOL Hey......next year when it's 31 degrees for a week or so I'm going to try to convince people to skate on the lake I mentioned.......I'm going to tell them you said it'd be frozen just fine. Well, you could tell them I said that, but you'd be lying. Here's what I actually wrote: "Your 90 day winter temps this year could have been 12 degrees or 31 degrees and your pond would have frozen, but I bet one of those is above normal and one is below." One week at 31?! Hey, that's the same as a 90 day winter temp at 31! Wait, no, no it's not. But this would require you to both acknowledge and understand the term 90 day winter temp. It's an actual thing--a 90 day average. Now, what I will say is that 12 and 31 are both below normal for your 90 day winter temps--so I was wrong on my guess that one was above normal (see how I did that--that's how somebody admits they're wrong). How do I know that? Yep, that silly little chart with all the data points. Oh, and all those years from the 60s and 70s that you remember your lake being frozen "EVERY WINTER," (<-- your all caps, not mine), how many of those had 90 day winter temps 31 or above? By my count it's at least 9, 7 of which are above 32. This shows there can be a range of 90 day average temps, including those 32 and above, and the lake will still freeze. I can't explain why you remember every winter when you were a kid being like this one because they weren't. I'm guessing it's because you remember the skating, not the temp. It being an every-winter occurrence for you to be able to skate during your childhood and the ice being thick enough to skate this year doesn't mean that this winter's temp is normal. You also continue to keep using normal without acknowledging that with weather, normal means average. When you said "the graphs establish average, not normal" it occurred to me that maybe, possibly, you just really didn't know that normal is defined as a long-term average. That's why I provided the NOAA definition. Here it is again, as you must have missed it. Normal- The long-term average value of a meteorological element for a certain area. For example, "temperatures are normal for this time of year" Usually averaged over 30 years. http://www.erh.noaa.gov/er/box/glossary.htm I don't care what your sense of normal is or what your memories of normal winters are--they're completely subjective and fallible. Certainly normal isn't defined by just the years you cherry-pick, or, in this case, ice skate or by the years of your or anyone else's childhood. How could anyone have a conversation about normal temps if that were the case? If we're talking about this winter being "below normal," which is, in fact, what started this whole thing, normal means average. When I said, "You guys have had a "normal" winter? Our 90 day temp averages are over 9 degrees below normal," I am just using the accepted definition. It's an established term. Google "below normal" and you'll see that it's used quite commonly.
Here's an example from your state climatologist: Regionally, February temperatures averaged between 10-12 degrees below normal across northern Missouri, 9-10 degrees below normal over central sections and 6-9 degrees below normal across southern Missouri...For the meteorological winter season, preliminary data indicate the Dec-Jan-Feb temperature average was around 27°F, slightly more than 5 degrees below normal, and the coldest Missouri winter in 35 years, or since the brutally cold winter of 1978-79. http://climate.missouri.edu/ Coldestwinter in 35 years. Below normal. You also said "my log shows first finds the last 10 years all before 3/15." According to this thread http://beginnertriathlete.com/discussion/forums/thread-view.asp?tid=484874&posts=24#M4728723 it was 4-17. (Funny, I remembered that post because I was new to BT and was so excited that among all the posts about TV shows and chit I didn't care about somebody else hunted morels.) I will be surprised if soil temps warm up enough for you to get greys in the first week of April, but here's a great resource for sightings and area message boards.http://morelhunters.com/index.php . It also has pretty good data back to 2010 for when morels are found by area. Last year was warmer than this one too. I found my firsts May 5th last year. We shall see... Edited by switch 2014-03-29 7:32 AM |

| 2014-03-29 8:57 AM in reply to: 0 |
Pro 15655 | Subject: RE: UN says 2013's extreme weather is due to warming earth Wanna know when turkeys will nest this year? No graph needed. It's just a matter of experience with a normal cold winter. Oh.....and I'll have grey morels by the end of this week. Walked the woods last night......earliest spots will have small greys by weekend. I don't know how I know this, I've only been going to the same spots for 20 years.....maybe I should check a web site? LOL Edited by Left Brain 2014-03-29 9:08 AM |
| 2014-03-29 9:44 AM in reply to: 0 |
Pro 15655 | Subject: RE: UN says 2013's extreme weather is due to warming earth Also, the pics you posted on the morels you found are yellows (last year was a bit late too, but not as much as this year will be)......you missed the greys by 2 weeks, and missed blacks by 3 weeks. Find sycamores in a creek bed with a south facing bank for earliest greys.. You'll get greys just a few days after onions start popping. Find black morels in the hills, well before any notable green, and at least a week before greys. We have found greys as early at 3/8 in the last few years.......and the guys with the good black morel holes were picking before that. They are picking bushels in Ga. right now. Hey, the snow goose northern migration was about 2 weeks late this year as well when compared to the last 10 years or so.......as always, no graph needed. Here's a pic from 3/24/12.....you know, weeks before your website says we should have yellows. LMAO We'd probably picked 2 gallons of greys by the time we took this pic. You might also note that mushroom had been up for 4-6 days already at least. (I made that determination from a mushroom graph
Edited by Left Brain 2014-03-29 9:59 AM (32412.jpg) Attachments ---------------- 32412.jpg (108KB - 1 downloads) |
 )
)| 2014-03-29 11:49 AM in reply to: Left Brain |
Regular 5477 LHOTP | Subject: RE: UN says 2013's extreme weather is due to warming earth Originally posted by Left Brain Also, the pics you posted on the morels you found are yellows (last year was a bit late too, but not as much as this year will be)......you missed the greys by 2 weeks, and missed blacks by 3 weeks. Find sycamores in a creek bed with a south facing bank for earliest greys.. You'll get greys just a few days after onions start popping. Find black morels in the hills, well before any notable green, and at least a week before greys. We have found greys as early at 3/8 in the last few years.......and the guys with the good black morel holes were picking before that. They are picking bushels in Ga. right now. Hey, the snow goose northern migration was about 2 weeks late this year as well when compared to the last 10 years or so.......as always, no graph needed. Here's a pic from 3/24/12.....you know, weeks before your website says we should have yellows. LMAO We'd probably picked 2 gallons of greys by the time we took this pic. You might also note that mushroom had been up for 4-6 days already at least. (I made that determination from a mushroom graph
Where are you looking on the morel website that you think your 3/24/12 is "weeks" before the site? Just the map? Read the St. Louis message board on the site and you'll see you're wrong. Again. Post from 3/22/12. I don't care if you ever use the morel site--you think you're omnipotent and omniscient. You can find mushrooms before everyone else! Sweet! Do it man! In the link that I posted from your thread last year about morels you said "First of the year........good eating the next few weeks!" But you're saying you found your greys before 3/8? Five weeks before your first yellow? That certainly is interesting and doesn't follow the time table you just outlined above. Funny, you failed to mention that in your own morel thread last year. It's very possible that I missed the first mushrooms last year, or every year for that matter, but as you can see from your spring thread, my pic from 2012 shows yellows and greys. I've never looked for blacks. Look at that, I seem to do ok--even without your morel hunting tips! And, no, this was not all the mushrooms I found that year.
You can't admit it when you're wrong when presented with data. You can't admit it when you're wrong when provided a definition of a term being discussed. You can't admit it when your memory or logs are wrong. You can't admit it when your own writing and posts on this site contradict what you say. In the face of all that, you try to move the target, make fun of the fact that I've presented data, or try to distort my words into lies and misrepresentation. Wow. For a guy who writes so much about doing the right thing, I'm very surprised you can't admit when you're wrong. I hope I'm wrong and you "have grey morels by the end of this week" (I'm just assuming "have" means "find" here?). Jeez, by your timetable then you ought to be able to find those blacks today! Better get busy :)
|

| 2014-03-29 12:53 PM in reply to: 0 |
Pro 15655 | Subject: RE: UN says 2013's extreme weather is due to warming earth Originally posted by switch Originally posted by Left Brain Also, the pics you posted on the morels you found are yellows (last year was a bit late too, but not as much as this year will be)......you missed the greys by 2 weeks, and missed blacks by 3 weeks. Find sycamores in a creek bed with a south facing bank for earliest greys.. You'll get greys just a few days after onions start popping. Find black morels in the hills, well before any notable green, and at least a week before greys. We have found greys as early at 3/8 in the last few years.......and the guys with the good black morel holes were picking before that. They are picking bushels in Ga. right now. Hey, the snow goose northern migration was about 2 weeks late this year as well when compared to the last 10 years or so.......as always, no graph needed. Here's a pic from 3/24/12.....you know, weeks before your website says we should have yellows. LMAO We'd probably picked 2 gallons of greys by the time we took this pic. You might also note that mushroom had been up for 4-6 days already at least. (I made that determination from a mushroom graph
Where are you looking on the morel website that you think your 3/24/12 is "weeks" before the site? Just the map? Read the St. Louis message board on the site and you'll see you're wrong. Again. Post from 3/22/12. I don't care if you ever use the morel site--you think you're omnipotent and omniscient. You can find mushrooms before everyone else! Sweet! Do it man! In the link that I posted from your thread last year about morels you said "First of the year........good eating the next few weeks!" But you're saying you found your greys before 3/8? Five weeks before your first yellow? That certainly is interesting and doesn't follow the time table you just outlined above. Funny, you failed to mention that in your own morel thread last year. It's very possible that I missed the first mushrooms last year, or every year for that matter, but as you can see from your spring thread, my pic from 2012 shows yellows and greys. I've never looked for blacks. Look at that, I seem to do ok--even without your morel hunting tips! And, no, this was not all the mushrooms I found that year.
You can't admit it when you're wrong when presented with data. You can't admit it when you're wrong when provided a definition of a term being discussed. You can't admit it when your memory or logs are wrong. You can't admit it when your own writing and posts on this site contradict what you say. In the face of all that, you try to move the target, make fun of the fact that I've presented data, or try to distort my words into lies and misrepresentation. Wow. For a guy who writes so much about doing the right thing, I'm very surprised you can't admit when you're wrong. I hope I'm wrong and you "have grey morels by the end of this week" (I'm just assuming "have" means "find" here?). Jeez, by your timetable then you ought to be able to find those blacks today! Better get busy
Here's your graph of normal weather.
Edited by Left Brain 2014-03-29 12:56 PM (bs graph.jpg) Attachments ---------------- bs graph.jpg (55KB - 1 downloads) |
| 2014-03-29 8:03 PM in reply to: switch |
Extreme Veteran 3025 Maryland Maryland | Subject: RE: UN says 2013's extreme weather is due to warming earth Originally posted by switch Originally posted by Left Brain Also, the pics you posted on the morels you found are yellows (last year was a bit late too, but not as much as this year will be)......you missed the greys by 2 weeks, and missed blacks by 3 weeks. Find sycamores in a creek bed with a south facing bank for earliest greys.. You'll get greys just a few days after onions start popping. Find black morels in the hills, well before any notable green, and at least a week before greys. We have found greys as early at 3/8 in the last few years.......and the guys with the good black morel holes were picking before that. They are picking bushels in Ga. right now. Hey, the snow goose northern migration was about 2 weeks late this year as well when compared to the last 10 years or so.......as always, no graph needed. Here's a pic from 3/24/12.....you know, weeks before your website says we should have yellows. LMAO We'd probably picked 2 gallons of greys by the time we took this pic. You might also note that mushroom had been up for 4-6 days already at least. (I made that determination from a mushroom graph
Where are you looking on the morel website that you think your 3/24/12 is "weeks" before the site? Just the map? Read the St. Louis message board on the site and you'll see you're wrong. Again. Post from 3/22/12. I don't care if you ever use the morel site--you think you're omnipotent and omniscient. You can find mushrooms before everyone else! Sweet! Do it man! In the link that I posted from your thread last year about morels you said "First of the year........good eating the next few weeks!" But you're saying you found your greys before 3/8? Five weeks before your first yellow? That certainly is interesting and doesn't follow the time table you just outlined above. Funny, you failed to mention that in your own morel thread last year. It's very possible that I missed the first mushrooms last year, or every year for that matter, but as you can see from your spring thread, my pic from 2012 shows yellows and greys. I've never looked for blacks. Look at that, I seem to do ok--even without your morel hunting tips! And, no, this was not all the mushrooms I found that year.
You can't admit it when you're wrong when presented with data. You can't admit it when you're wrong when provided a definition of a term being discussed. You can't admit it when your memory or logs are wrong. You can't admit it when your own writing and posts on this site contradict what you say. In the face of all that, you try to move the target, make fun of the fact that I've presented data, or try to distort my words into lies and misrepresentation. Wow. For a guy who writes so much about doing the right thing, I'm very surprised you can't admit when you're wrong. I hope I'm wrong and you "have grey morels by the end of this week" (I'm just assuming "have" means "find" here?). Jeez, by your timetable then you ought to be able to find those blacks today! Better get busy
Why does it always have to be the BLACK mushrooms also you are making LB have way too much fun by being mad |

| 2014-03-31 8:58 AM in reply to: tuwood |
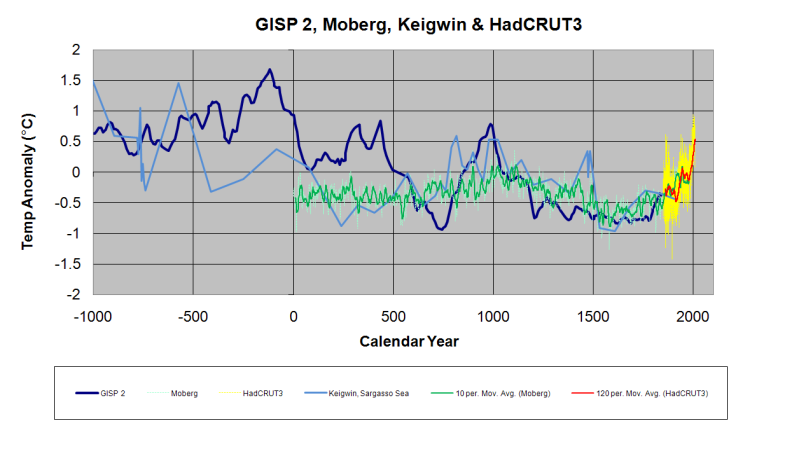
Pro 9391 Omaha, NE | Subject: RE: UN says 2013's extreme weather is due to warming earth OK, back at work. Now I can take a few minutes to answer these. lol Umm, your numbers? Even if you use the low end of your numbers we'll warm nearly that much. We've already warmed 0.8*C. If we warm 0.3*C every 30 years that's 0.9*C more this century and 1.7*C overall. As long as we track at the very low end. I'm confused as to what you're saying. We've already warmed .8° C from when to when? I think you're saying from 1900 to today, but I'm just guessing.
btw, the 2 degrees I mentioned was just responding to Switch mentioning devastation if temperature goes up 2 degrees. You know it's cumulative thing, right? The warming this century will be on top of the warming we already have. We're already seeing pretty profound changes around the world at the 0.8*C warming we have now. For one thing, LBs 'shrooms are coming up later, which is baaad news. Even the low end, optimistic, denialist dream warming is 1.5*C by the end of the century which is almost double what we've seen so far. It might not be the 'worldwide devastation' the denialists like to alarm the denialists about the alarmists about but it's going to be some big changes. admittedly I haven't heard this logic before. Who gets to pick the start date for the warming that "counts"? I'm still confused how you can say that we've had .8 degrees warming this century when temperatures have been flat so far. As mentioned above, I'm going to guess you're going back 100 years from today, which yes the warming has gone up approx .8 degrees. However, half of that warming happened prior to 1950 and the rapid increase in CO2, so how can that be calculated into the AGW discussion? As for the low end, optimistic, denialist dream warming being 1.5* C by the end of the century. The IPCC in their last final report projects 30 year warming of .3 - .7* C and says they expect the warming to be at the lower end of that scale or .4* C per 30 or 1.3* C for the 21st Century. I wouldn't go so far to call the IPCC denialists, but they're the experts and I can only convey what they're reporting. btw, I'm not a denialist. Denialists deny that the earth is warming. I absolutely agree that it's warming and I agree that man is a contributing factor. I simply haven't seen any scientific data that accurately quantifies our contribution and feel the impacts of a gradually warming planet are minimal. The data also supports that our planet has been steadily warming for a solid 250 years as well. We know that that avg global temp for the 20th century is about 57.2*F. And we know the range of the variability from that avg that we'd expect to see if there were no forcings adding energy to the climate. We don't expect the earth's temp to be exactly 57.2*F every year, we expect some years to be above that and some to be below that, and most of the time to fall within a certain range - this range around the mean is the natural variability. The increase from 1925-1944 (BTW - the change was only about 0.3* for this period) falls within this range of natural variability from the mean. We went from about 0.2*F below avg to about 0.1*F above avg. In contrast, the temp change we saw starting in the late 70's started at about the 20th century avg and has gone up to nearly 0.6*F above avg, which is outside the range of natural variability. In addition, if it were solely due to natural variability, we'd expect to see temps below avg as well as above, but that's not what we're seeing. We're seeing only deviations above avg, which lets us know that something else besides natural variability is driving the changes. OK, I'm having a hard time following you on this. I know what your saying but I think your logic is faulty. The 20th Century trended upwards for the entire century. The natural variability has to be based off of the upward trend, it can't be based on deviations from a flat line average because if that were the case then even if there was zero variation from the upward trend (zero CO2 forcing) it would still be higher at the end of the century because of the underlying trend. Here's two pictures of forest fires. One was caused by lighting and one was caused by humans. Which is which? I know you're just trying to be funny, but you didn't answer the question. How can a roughly equivalent level of warming from 1895 to 1946 be natural and the same level of warming from 1947 to 2008 be man made and primarily driven by CO2? Is there is no possible chance that the warming post 1950 could be driven by the same natural factors that drove the near identical level of warming prior to 1950? That would seem at least a logical scientific assumption unless proven otherwise right. Maybe it would be a little more helpful to see the data actually plotted instead drawn by someone at their desk. Here's temperature for the last 11,000 years. It's a little outdated but'll have to do. lol, where'd you get that diagram from? I've looked at almost every study on paleoclimate temperature data and have never seen anything even close to that one. Mann's Hockey Stick is the general "scary diagram" that everyone likes to throw around, but that one was thrown under the bus by the IPCC in AR5 as well. “Continental-scale surface temperature reconstructions show, with high confidence, multi-decadal intervals during the Medieval Climate Anomaly (950−1250) that were in some regions as warm as in the late 20th century. These intervals did not occur as coherently across seasons and regions as the warming in the late 20th century (high confidence).” Translated, the IPCC agrees with high confidence that there were regions as warm or warmer in the MWP as the 20th century. As for the diagram drawn by someone at their desk. Here's the background on the graph, and I used it simply because it's an easy to read diagram that was referenced by the IPCC in their annual report. http://climateaudit.org/2008/05/09/where-did-ipcc-1990-figure-7c-come-from-httpwwwclimateauditorgp3072previewtrue/ Obviously paleoclimate isn't an exact science and there is a lot of debate on the topic. There have been many studies trying to graph pre 20th century temperatures. Here's some other peer reviewed studies representing the MWP. The important note is that the IPCC agrees with high confidence that the MWP is legitimate. 2,500 Years – GISP2 – Alley, 2000 The common theme of all the diagrams is that we're in an extended warming trend that predates the 20th century. Hence, the natural variability has to account for the upward trend into their methodology which many of the alarmist models did not properly do You should make a pie with all the cherries you picked here. 1st of all, no scientists don't agree there's been no increase in temps since 1998. In fact 13 of the 14 hottest years ever were in this century and 2001-2010 was the hottest decade on record. Why start at that particular year? Because 1998 just happened to be one of the hottest years on record. If you start at any other year, surprise, surprise, you get an increasing trend. But wait, it turns out that even if you start at 1998 there's a positive trend, although yes, it's lower. You're on a roll with the propaganda diagrams. All I can say is you are in disagreement with both the MET office and the IPCC in your assessment that there has been no warming in recent years. “The world stopped getting warmer almost 16 years ago, according to new data released last week. The figures, which have triggered debate among climate scientists, reveal that from the beginning of 1997 until August 2012, there was no discernible rise in aggregate global temperatures. This means that the ‘plateau’ or ‘pause’ in global warming has now lasted for about the same time as the previous period when temperatures rose, 1980 to 1996. Before that, temperatures had been stable or declining for about 40 years.” Shortly after this report was released NASA's James Hansen and Reto Ruedy also acknowledged that global temperatures have not risen for more than a decade. (source) Then Rajendra Pachauri, head of the UN IPCC ackowledged it (source) On a side note, I find it interesting that in order to break the trend from 1980 - 1996 we have to have a non warming trend for twice as long before they'll acknowledge it. hmm So, I'm comfortable in my statement and the scientific backing that there has been no increase in temperatures since the late 90's and there's no arguing it. Ocean heat content has increased since the 1990's. That's based on factual data, so there's no arguing it. And when you combine the atmospheric temperatures (which have seen a decrease in the rate of warming) and the heat in the oceans it turns out that overall warming has actually sped up over the last 15 years, even though atmospheric warming has slowed down. The reason for the slowdown is still being researched, but like you mention, much of the extra heat is being stored in the oceans. Increased aerosols are thought to play a part as is natural variability - this period has seen more La Ninas than normal which are associated with a lower global temperature than normal (although the last 4 La Nina years had higher avg temps than any El Nino year before 1998). As I mentioned, the ocean is the latest "theory" as to the pause in global surface temperature warming, but there really isn't any solid evidence that I've seen linking the two and the heating isn't consistent across all oceans. Primarily the Indian Ocean and South Atlantic have been warming while the Pacific and North Atlantic have not. If you combine them all, it's either been flat or barely increased on a global scale. It would also appear that most of the research leads to natural variability as the cause of this warming and cooling as well and not AGW. In the IPCC WG1 executive summary they describe ocean heat patterns pretty well. (source) The oceans are warming. Over the period 1961 to 2003, global ocean temperature has risen by 0.10°C from the surface to a depth of 700 m. Consistent with the Third Assessment Report (TAR), global ocean heat content (0–3,000 m) has increased during the same period, equivalent to absorbing energy at a rate of 0.21 ± 0.04 W m–2 globally averaged over the Earth’s surface. Two-thirds of this energy is absorbed between the surface and a depth of 700 m. Global ocean heat content observations show considerable interannual and inter-decadal variability superimposed on the longer-term trend. Relative to 1961 to 2003, the period 1993 to 2003 has high rates of warming but since 2003 there has been some cooling. Here's another thing that's very misleading about the graph you posted. It looks very ominous and "scary", but according to the study that provides the source data it's not quite as ominous: World ocean heat content and thermosteric sea level change (0–2000 m), 1955–2010
In summary, I'm sure we can go back and forth citing this or that, but there really is no denying that the earth has warmed and there's not denying that CO2 is a contributing factor. However, there's also no denying that the earth has been in a warming trend that pre-dated the massive increases in CO2. |


| 2014-03-31 9:26 AM in reply to: tuwood |
Pro 15655 | Subject: RE: UN says 2013's extreme weather is due to warming earth Tony - my head hurts from even lookng at that. |
| 2014-03-31 9:43 AM in reply to: Left Brain |
Champion 6993 Chicago, Illinois | Subject: RE: UN says 2013's extreme weather is due to warming earth Global warming could make us all fat? I saw this from a men's health email but to be fair they think it might not be true. http://www.menshealth.com/weight-loss/whats-really-making-us-fat?cm... |
| 2014-03-31 12:36 PM in reply to: 0 |
Master 4101 Denver | Subject: RE: UN says 2013's extreme weather is due to warming earth Originally posted by tuwood That was a boat load of stuff so I'll address what I can-
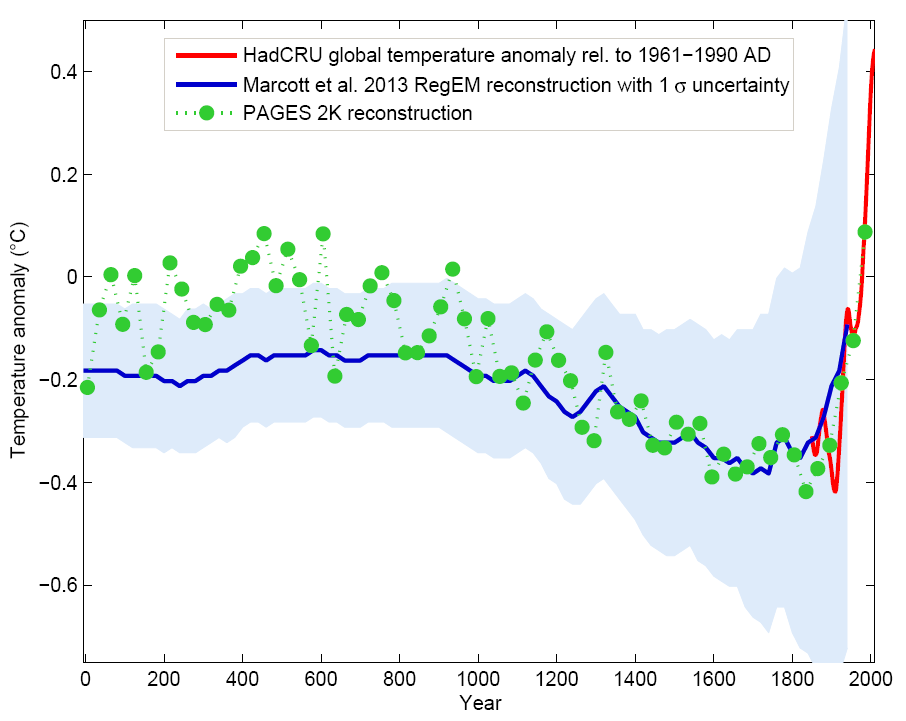
In summary, I'm sure we can go back and forth citing this or that, but there really is no denying that the earth has warmed and there's not denying that CO2 is a contributing factor. However, there's also no denying that the earth has been in a warming trend that pre-dated the massive increases in CO2. - The 0.8* rise is above the 20th C avg (your graph is using the 1961-90 avg as a baseline which was a cool period which is why is only shows we're only 0.6* above avg) . Ideally what you want to compare it to is the pre-industrial temp because what we're interested in is the amount of warming we're causing - how much hotter is is now that if we weren't putting GHGs into the atmosphere. The reason we know the 1970-> warming is different from the 1910-40ish warming is that the earlier warming fell within the range of natural variation - (it went from below avg to slightly above). The later warming extended well above the range of natural variation and stayed there (also, if it was only due to natural variation we would expect to see below avg deviations, but we don't see any of them in the later warming), meaning some other process has to be at work. Like you mention, without CO2 forcing we'd expect the 20th C avg temp to show no trend, but instead we see an upward trend. We will still get natural variability in the system, it will just be around this upward shifted mean. If the later warming was only being caused by natural variation we'd expect 1) the mean temperature should show no trend 2) the warming should for the most part stay within the range of natural variability around this mean. 3) there should be a roughly equal amount of deviation above and below the mean. The fact that we're seeing a positive trend, deviations outside the range we would expect if CO2 was having no effect and a bias towards deviations above the mean all show that this warming is being driven by something different from the earlier warming. There are many other fingerprints of human-caused warming such as more warming during the night than day, cooling of the stratosphere, etc. Don't know if that clears it up for you or not... - The graph of holocene temps is from this paper in Science and it shows pretty clearly that when you zoom in, you can see quite clearly that temperatures were not on an increasing trend before we started messing with the climate system. Overall, the last 2,000 years have seen a cooling trend. Until our CO2 came along anyway.
I have no dispute with the MWP or that certain regions were as warm as it is today. But it was only certain regions, not a global phenomenon. While some regions such as Europe were warm, other regions were even colder than during the Little Ice Age. - Saying there's been no warming since the 90's is only correct if you cherry pick the start year or if you look at a really short time period (5 year avg which will be dominated by natural variability), and only consider atmospheric temps. It's true to say the rate of warming over the land has slowed down (or been on a pause, or hiatus or whatever term you want to use, except for 'reversed'). It's important to note, we haven't returned to 'normal' -heh- and we're still well outside of the range of natural variability without any CO2 forcing) since the 1990's, it's just not correct to say that warming has stopped. This year's summary from Hansen, Sato and Ruedi says that "The five-year running-mean of the global temperature (Fig. 4b) has been flat for several years, but the 11-year mean continues to rise at a reduced rate." As for Rajendra Pachauri, the IPCC communications office has said that that article "does not accurately represent Pachauri's thoughts on the subject" and the guy who wrote that op-ed isn't known for his accuracy. Here's what the Brisitsh Met office has to say "there has been little further warming of the surface, particularly over the ocean in the most recent 10 to 15 years. As discussed in the first paper in this series, there is substantial evidence from other components of the climate system, beyond the global mean surface temperature, that the Earth has continued to warm over the last decade." The message of Lozier isn't that everything is being driven by natural variability, it's that in N. Atlantic heat content, natural variability has a large signal so "whether the overall heat gain is due to anthropogenic warming is difficult to confirm because strong natural variability in this ocean basin is potentially masking such input at the present time." Measuring the heat content in Joules is more appropriate because what we care about is the amount of energy being stored, after all, 90% of the extra energy being retained by the earth is going into the oceans. You may remember from science class that water has a higher thermal inertia than air - it takes more energy to raise the temperature of a given volume of water than an equal volume of air. If I remember right, it takes something like 4x more energy to heat water than air an equal amount, so if you go by temperature it looks like a small change, that amount of absolute change of energy is much larger, which is why they use joules. There is actually strong evidence that heat uptake by the oceans is playing an important role (here and here and here for example). This increased heat uptake could very well be caused by natural variability, but that's actually bad news because it means that the trend of increased heat uptake in the Pacific will end as the natural variability swings the other direction, and atmospheric temps will resume their upward trend. It's true that the models are only as good as the assumptions that go into them. We have a really good idea of the range of natural variability, that's just statistics, but CO2 forcing is much harder. Yes, the IPCC revised the lower bound of their estimate of forcing in the last report, but that was based on a single study which has since been shown to have some issues. Studies that have come out since have reaffirmed a forcing value pretty much in the middle of the estimates. In my mind, the bigger uncertainty comes from guesses at how much more CO2 we'll emit, which obviously has a big impact. You can run the models with different scenarios for CO2 emissions, but that uncertainty is a big reason it's hard to pin a value on the expected temp in 2100. The problem with that thinking though is that it's not like warming is going to shut off in 2100 and it's not like our estimates of future effects are based solely on models. Paleoclimate data is at least as important as modeling results in figurnig out what the effects of a warmer world will be. For example, we know that the last time CO2 levels reached what they are now (~400ppb about 3-3.5 million years ago), conifers grew along the arctic ocean, beech trees grew in antarctica and sea level was about 25m (75') higher than it is now. Now there's no saying that'll happen this time - past performance does not guarantee future results. But it gives us a realistic scenario for how the earth responded in the past to the conditions we're now creating.
Edited by drewb8 2014-03-31 12:37 PM |
| 2014-03-31 1:57 PM in reply to: drewb8 |
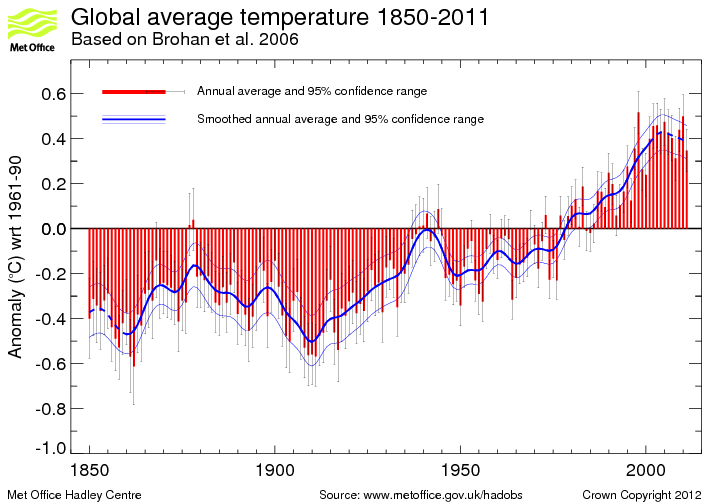
Pro 9391 Omaha, NE | Subject: RE: UN says 2013's extreme weather is due to warming earth I think perhaps the main difference between you and I Drew is how we're seeing the earths "normal" non Anthropological forced temperature. Obviously there has to be some forcing (natural or man made) to make the earths temperature go up, it's just a matter of figuring out what the dominant forcing agent is. Just so I'm interpreting what you're saying. Lets just use this graph as an example because it's based on fairly accurate instrument data in the modern era: Your'e saying the "average" temperature trend line should be (just guessing) around -.2 assuming we stop the graph at 1970ish. With that the global temperature would be going up and down across that axis and depicting normal variation. Whereas the post 1970 warming exceeds the maximum variability of that relatively flat trend. If I read you right, that makes sense. So, it really boils down to the accuracy of the pre-1850 climate measurements which I'm sure both you and I can agree are nowhere near as accurate as what we have today. So if this graph representing the last 2500 years is accurate the 20th century warming wouldn't necessarily be uncharacteristic of natural variability over a geological time scale.
Then looking at the one you posted, the recent temperature increase does seem more uncharacteristic of the long term trend from a gological scale standpoint, but I do notice that it still has a sharp up-turn that starts in the 1800's and continues the sharp upward trend through the 20th century. So there is still the question of forcing prior to CO2 that I'm curious about.
I know you and I have discussed many times before that the "alarmists" aren't exactly following the science, so I try to discount the "day after tomorrow" crowd and not lump all AGW proponents in that crowd. Much in the same way there are folks who refuse to accept that the earth is warming at all and man has zero contribution to it. Those are the true "deniers". I guess I'm more of a luke warmer, and maybe you are too. ;-) I'm personally a big proponent of alternative power and am seriously close to getting on the waiting list for a Tesla. I love the nerd factor of it all and plan to use solar extensively in our country house we plan to build in about 5 years. I don't do it because I think the earth is going to explode, I do it because I like the nerd factor and the "off grid" aspect of it. Where I get my panties in a bunch is investing a ton of government money into "big green" type programs that make no economical or practical sense in the long run. Things like carbon tax and junk like that always tick me off.
|
| 2014-03-31 3:50 PM in reply to: tuwood |
Master 4101 Denver | Subject: RE: UN says 2013's extreme weather is due to warming earth Originally posted by tuwood I think perhaps the main difference between you and I Drew is how we're seeing the earths "normal" non Anthropological forced temperature. Obviously there has to be some forcing (natural or man made) to make the earths temperature go up, it's just a matter of figuring out what the dominant forcing agent is. Just so I'm interpreting what you're saying. Lets just use this graph as an example because it's based on fairly accurate instrument data in the modern era: Your'e saying the "average" temperature trend line should be (just guessing) around -.2 assuming we stop the graph at 1970ish. With that the global temperature would be going up and down across that axis and depicting normal variation. Whereas the post 1970 warming exceeds the maximum variability of that relatively flat trend. If I read you right, that makes sense. Yup! So, it really boils down to the accuracy of the pre-1850 climate measurements which I'm sure both you and I can agree are nowhere near as accurate as what we have today. So if this graph representing the last 2500 years is accurate the 20th century warming wouldn't necessarily be uncharacteristic of natural variability over a geological time scale. So we're really looking at two different natural variabilities. We have the short term natural variabilty that we see in the top graph which is basically weather. Some years, even stretches of a decade or something will be above avg, some will be below, but overall they fluctuate around the mean climate avg. Long-term natural variability is associated with a change in the climate - a change in the mean temperature. A change in the mean must be caused by some sort of forcing - an change in the balance of incoming vs outgoing energy. Some forcing are local in scale such as the in the ice-core recordin the graph above which shows the effect on temps in Greenland of cyclical ice rafting events. Some forcing events are global in scale such as the change in the tilt of the Earths axis which is responsible for the ice ages or changes in incoming solar radiation or volcanic ash.
But in the case of the recent warming, tons of research has looked into all of these and other possibilities and found that the only significant forcing which can explain the warming we're seeing is the CO2 we're adding. There is no other mechanism occurring right now which can explain the increased amount of energy the earth is retaining. There are also 'fingerprints' that identify the CO2 we're adding as the cause of the warming. For example, night time temps have been increasing faster than day time temps. We also see cooling of the stratosphere. Both of these mean it must be increased trapping of heat by the atmosphere (CO2 and other GHGs) which are responsible for the warming and not some other process. There are several other indicators which show the same thing. Then looking at the one you posted, the recent temperature increase does seem more uncharacteristic of the long term trend from a gological scale standpoint, but I do notice that it still has a sharp up-turn that starts in the 1800's and continues the sharp upward trend through the 20th century. So there is still the question of forcing prior to CO2 that I'm curious about. I get where you're coming from on the political side of things, although I'd definitely disagree that investing in 'green' programs makes no economic or practical sense. But these are issues with the politics, not the science. Denying there's a problem or dismissing it by saying it'll be fine (or even a good thing!) are desperate attempts to rationalize inaction and keep the status quo. The thing is that's it's totally short sighted too. By denying there's even a problem, skeptics take themselves out of any conversation about solutions, guaranteeing that when we finally decide that we have to take action (and I guarantee that time will come, and probably sooner than we think), they'll have no credibility and influence over the solution, increasing the odds it'll be something they don't like. In the end it doesn't matter how we limit emissions, just that we do. The IPCC report out today makes that clearer than ever.
I know you and I have discussed many times before that the "alarmists" aren't exactly following the science, so I try to discount the "day after tomorrow" crowd and not lump all AGW proponents in that crowd. Much in the same way there are folks who refuse to accept that the earth is warming at all and man has zero contribution to it. Those are the true "deniers". I guess I'm more of a luke warmer, and maybe you are too. ;-) I'm personally a big proponent of alternative power and am seriously close to getting on the waiting list for a Tesla. I love the nerd factor of it all and plan to use solar extensively in our country house we plan to build in about 5 years. I don't do it because I think the earth is going to explode, I do it because I like the nerd factor and the "off grid" aspect of it. Where I get my panties in a bunch is investing a ton of government money into "big green" type programs that make no economical or practical sense in the long run. Things like carbon tax and junk like that always tick me off. |
| 2014-04-01 7:57 AM in reply to: drewb8 |
Pro 9391 Omaha, NE | Subject: RE: UN says 2013's extreme weather is due to warming earth Originally posted by drewb8 Originally posted by tuwood I think perhaps the main difference between you and I Drew is how we're seeing the earths "normal" non Anthropological forced temperature. Obviously there has to be some forcing (natural or man made) to make the earths temperature go up, it's just a matter of figuring out what the dominant forcing agent is. Just so I'm interpreting what you're saying. Lets just use this graph as an example because it's based on fairly accurate instrument data in the modern era: Your'e saying the "average" temperature trend line should be (just guessing) around -.2 assuming we stop the graph at 1970ish. With that the global temperature would be going up and down across that axis and depicting normal variation. Whereas the post 1970 warming exceeds the maximum variability of that relatively flat trend. If I read you right, that makes sense. Yup! So, it really boils down to the accuracy of the pre-1850 climate measurements which I'm sure both you and I can agree are nowhere near as accurate as what we have today. So if this graph representing the last 2500 years is accurate the 20th century warming wouldn't necessarily be uncharacteristic of natural variability over a geological time scale. So we're really looking at two different natural variabilities. We have the short term natural variabilty that we see in the top graph which is basically weather. Some years, even stretches of a decade or something will be above avg, some will be below, but overall they fluctuate around the mean climate avg. Long-term natural variability is associated with a change in the climate - a change in the mean temperature. A change in the mean must be caused by some sort of forcing - an change in the balance of incoming vs outgoing energy. Some forcing are local in scale such as the in the ice-core recordin the graph above which shows the effect on temps in Greenland of cyclical ice rafting events. Some forcing events are global in scale such as the change in the tilt of the Earths axis which is responsible for the ice ages or changes in incoming solar radiation or volcanic ash.
But in the case of the recent warming, tons of research has looked into all of these and other possibilities and found that the only significant forcing which can explain the warming we're seeing is the CO2 we're adding. There is no other mechanism occurring right now which can explain the increased amount of energy the earth is retaining. There are also 'fingerprints' that identify the CO2 we're adding as the cause of the warming. For example, night time temps have been increasing faster than day time temps. We also see cooling of the stratosphere. Both of these mean it must be increased trapping of heat by the atmosphere (CO2 and other GHGs) which are responsible for the warming and not some other process. There are several other indicators which show the same thing. Then looking at the one you posted, the recent temperature increase does seem more uncharacteristic of the long term trend from a gological scale standpoint, but I do notice that it still has a sharp up-turn that starts in the 1800's and continues the sharp upward trend through the 20th century. So there is still the question of forcing prior to CO2 that I'm curious about. I get where you're coming from on the political side of things, although I'd definitely disagree that investing in 'green' programs makes no economic or practical sense. But these are issues with the politics, not the science. Denying there's a problem or dismissing it by saying it'll be fine (or even a good thing!) are desperate attempts to rationalize inaction and keep the status quo. The thing is that's it's totally short sighted too. By denying there's even a problem, skeptics take themselves out of any conversation about solutions, guaranteeing that when we finally decide that we have to take action (and I guarantee that time will come, and probably sooner than we think), they'll have no credibility and influence over the solution, increasing the odds it'll be something they don't like. In the end it doesn't matter how we limit emissions, just that we do. The IPCC report out today makes that clearer than ever.
I know you and I have discussed many times before that the "alarmists" aren't exactly following the science, so I try to discount the "day after tomorrow" crowd and not lump all AGW proponents in that crowd. Much in the same way there are folks who refuse to accept that the earth is warming at all and man has zero contribution to it. Those are the true "deniers". I guess I'm more of a luke warmer, and maybe you are too. ;-) I'm personally a big proponent of alternative power and am seriously close to getting on the waiting list for a Tesla. I love the nerd factor of it all and plan to use solar extensively in our country house we plan to build in about 5 years. I don't do it because I think the earth is going to explode, I do it because I like the nerd factor and the "off grid" aspect of it. Where I get my panties in a bunch is investing a ton of government money into "big green" type programs that make no economical or practical sense in the long run. Things like carbon tax and junk like that always tick me off. OK, you had me up until the end. There is "denying there's warming", and then "denying that there's a problem" which are two distinctly different things. I like to say they have to prove that there is a problem more than I have to prove that there isn't one. If this century warms by 1* C similar to the last century then I'm going to say that it's not a problem any more than it was a problem last century. Yes, the weather will change, but it will be slow enough that we can easily adapt. If it's on the high side of the alarmist predictions then absolutely there is a very big problem and we need to deal with it quickly assuming it's even possible. So the question is, which side of the spectrum is right and how far should the government go to address it? All of the IPCC predictions and models are based on a confidence level including CO2's forcing effects. Nobody is saying for certain that CO2 is the primary driver or that the earth will be at 2, 3, or 4 degrees warmer in 100 years. They are simply making predictions based on models that haven't done so well historically. The "high confidence" number for the IPCC is just 1.3* C for this century with the confidence falling further and further the warmer you go. I'm not saying the alarmist projections are wrong, but to say we have to make drastic changes now is the only way to save the planet is just crazy based on that kind of historical track record. If we predicted 2 degrees of warming in 15 years and we hit 2 degrees in 15 years then I would give a lot more weight to the alarmist models. If anything the model's have shown a good example of what the temperatures are not going to do because real world data has been consistently tracking the lower boundaries, so I tend to adjust my personal alarm along the lines of the lower end of the projections which per the IPCC will have a very low economic impact worldwide. The UN report today is alarmism on steroids, but unfortunately for them the actual scientific data in the full report doesn't support the alarmism. The thought in the skeptical crowd is that the UN hypes it in the summary to give the politicians what they want, but put the real and far less alarmist data in the report to save a semblance of scientific credibility. Here's a dataset graph that averages the monthly anomalies for the three terrestrial and two satellite temperature records and overlays it onto the CO2 trend. From the IPCC Summary for Policy Makers - AR5: No best estimate for equilibrium climate sensitivity can now be given because of a lack of agreement on values across assessed lines of evidence and studies. So basically they're saying they really don't know what the temperature is going to be. I'll also add that in order to get to the high side of their projection of a 4.5* C increase in surface temperatures we will have to have global surface temperatures increase at a rate of 5.2* C/century for the next 86 years to bring global temperatures up to that level by 2100. Historically according to HadCRUT4 the fastest global warming rate during any decade in the 20th Century was 2* C. The 33 year period from 1974 - 2006 was equivalent to that rate of increase. If we start today and run at that record rate of increase through the rest of the 21st century we will be at 1.75*C by the year 2100. So to put that in context, for the next 86 years we have to run at a near record rate of increased global warming in order to even hit the minimum IPCC projection of 1.5* C of increase. So I'm pretty comfortable that we won't even attain that. The fastest super warming rate ever recorded anywhere was during the 40 years 1694-1733, which was before the industrial revolution began. Then the Central England record, the world’s oldest and a demonstrably respectable proxy for global temperature change, showed warming at a rate equivalent to 4.3* C/century, but nothing like it has been seen since. Here's a recent graph that shows the same data earlier compared to the IPCC AR5 surface temperature projections over the last 10 years. It shows the ever widening gap between reality and their predictions. So, until the empirical evidence starts to line up with their predictions I'm going to be in the camp of "they still need to prove to me there's a problem". |


| 2014-04-01 12:28 PM in reply to: tuwood |
Master 4101 Denver | Subject: RE: UN says 2013's extreme weather is due to warming earth You have a few mistakes in there. For one, yes, scientists are absolutely saying that CO2 is the primary driver, and the models they're basing it on have actually done very well historically. You are right that currently temperatures are tracking at the lower range of predictions, but they are still within the range the models predict. In addition, models do not incorporate natural variability, since the point of models is to investigate long term trends, and over the long term natural variability should cancel out. They also don't incorporate changes in human behvaior - for example, they don't incorporate decreased CO2 emissions due to the rrecent global recession because that type of stuff is basically unpredictable. When known natural variations are included in models, such as the recent prevalence of La Ninas, the models match observations extremely well. The fact that even though surface temperature avg increase has paused, but the number of record warm temperatures has continued to increase also hints to there being more to meets the eye with the pause. The big uncertainty in forcasting future temperatures is not in the models, which actually show high levels of skill (we also know this from calibration studies where scientists use the models to forecast past temperatures and the models do this very well), it's from the uncertainty in how much more CO2 we'll add to the atmosphere. The IPCC in their last report gave a climate sensitivity of 1.5-4.5*C for a doubling of CO2, but most studies continue to come in at the value being about 3*C (the lower value of 1.5* was based on a single study which has since been shown to have issues. Other studies since the publication of the IPCC report have come inn around 3* as well). As noted before, models are only one part of predicting future temperatures, looking at how climate and ecosystems have responded in the past to similar CO2 levels also plays an important role. If anything the IPCC tends to err to the conservative side of things. That's just the nature of trying to get scientific and political representatives from 110 or whatever countries to come to a consensus on every single word in the reports. I'm not one to advocate action for action's sake, but I think those holding out hope that reality will turn out on the low end of predictions are doing some faulty risk accounting. The fact that warming has only held steady, not reversed, and that the evidence that the current 'pause' is in large part due to natural variability mean that this tracking on the low end of things is likely only temporary. Climate change also has characteristics that make it different from other risks such as the fact that for all intents and purposes it's non-reversible. Climate also behaves as a complex system (the stock market and ecosystems are other examples of complex systems), and complex systems are characterized by non-linear change and abrupt thresholds which are often only apparent in hindsight. This can make adaption much more difficult. I don't think the climate my daughter will inherit will be unlivable, and for the most part, I think the wealthy countries such as ours will be able to adapt, at least in the short term. But even low levels of adaptation aren't free. People are already talking about a flood barrier for New York harbor at the cost of billions. Levees don't just raise themselves. Relocating people as sea levels rise or increased government spending to help people affected by increased extreme weather events means either less money for other government priorities such as education and national defense, higher taxes, or both. The changes we're already seeing at 0.8*C are already producing bigger changes and happening faster than scientists expected and we're only at the very beginning.
|
| 2014-04-01 12:50 PM in reply to: drewb8 |
Pro 15655 | Subject: RE: UN says 2013's extreme weather is due to warming earth First mushroom found in Missouri this past weekend down in Branson. Tennesse, Oklahoma, Arkansas all reporting first finds as well......bushels being picked in Ga. and 'Bama. Dandelions popping here in East Central, Mo. We'll have our first finds any day now. About 3 weeks later than 2012, the last warm, wet, spring. That year the first finds in Minnesota were the first week in April, and Morels were found in Ontario by the first week in May. |
| 2014-04-01 1:00 PM in reply to: Left Brain |
Master 4101 Denver | Subject: RE: UN says 2013's extreme weather is due to warming earth Originally posted by Left Brain Can you pick them as soon as they appear or does it take them a little while to get up to the right size? I'm guessing you have some morel standards?First mushroom found in Missouri this past weekend down in Branson. Tennesse, Oklahoma, Arkansas all reporting first finds as well......bushels being picked in Ga. and 'Bama. Dandelions popping here in East Central, Mo. We'll have our first finds any day now. About 3 weeks later than 2012, the last warm, wet, spring. That year the first finds in Minnesota were the first week in April, and Morels were found in Ontario by the first week in May. |
|
|
|
|
| Weather reporters........ Pages: 1 2 | ||
| |||
|
 View profile
 Add to friends
 Go to training log
 Go to race log
 Send a message
 View album